
 Analytics
The numbers are there. Veydex makes them legible.
Your numbers already exist. They just sit in separate reports that know nothing about each other. Analytics brings them together — and it is included in the Hub.
The overview comes with it.
Analytics joins the data from the modules you have booked into one view of your business.
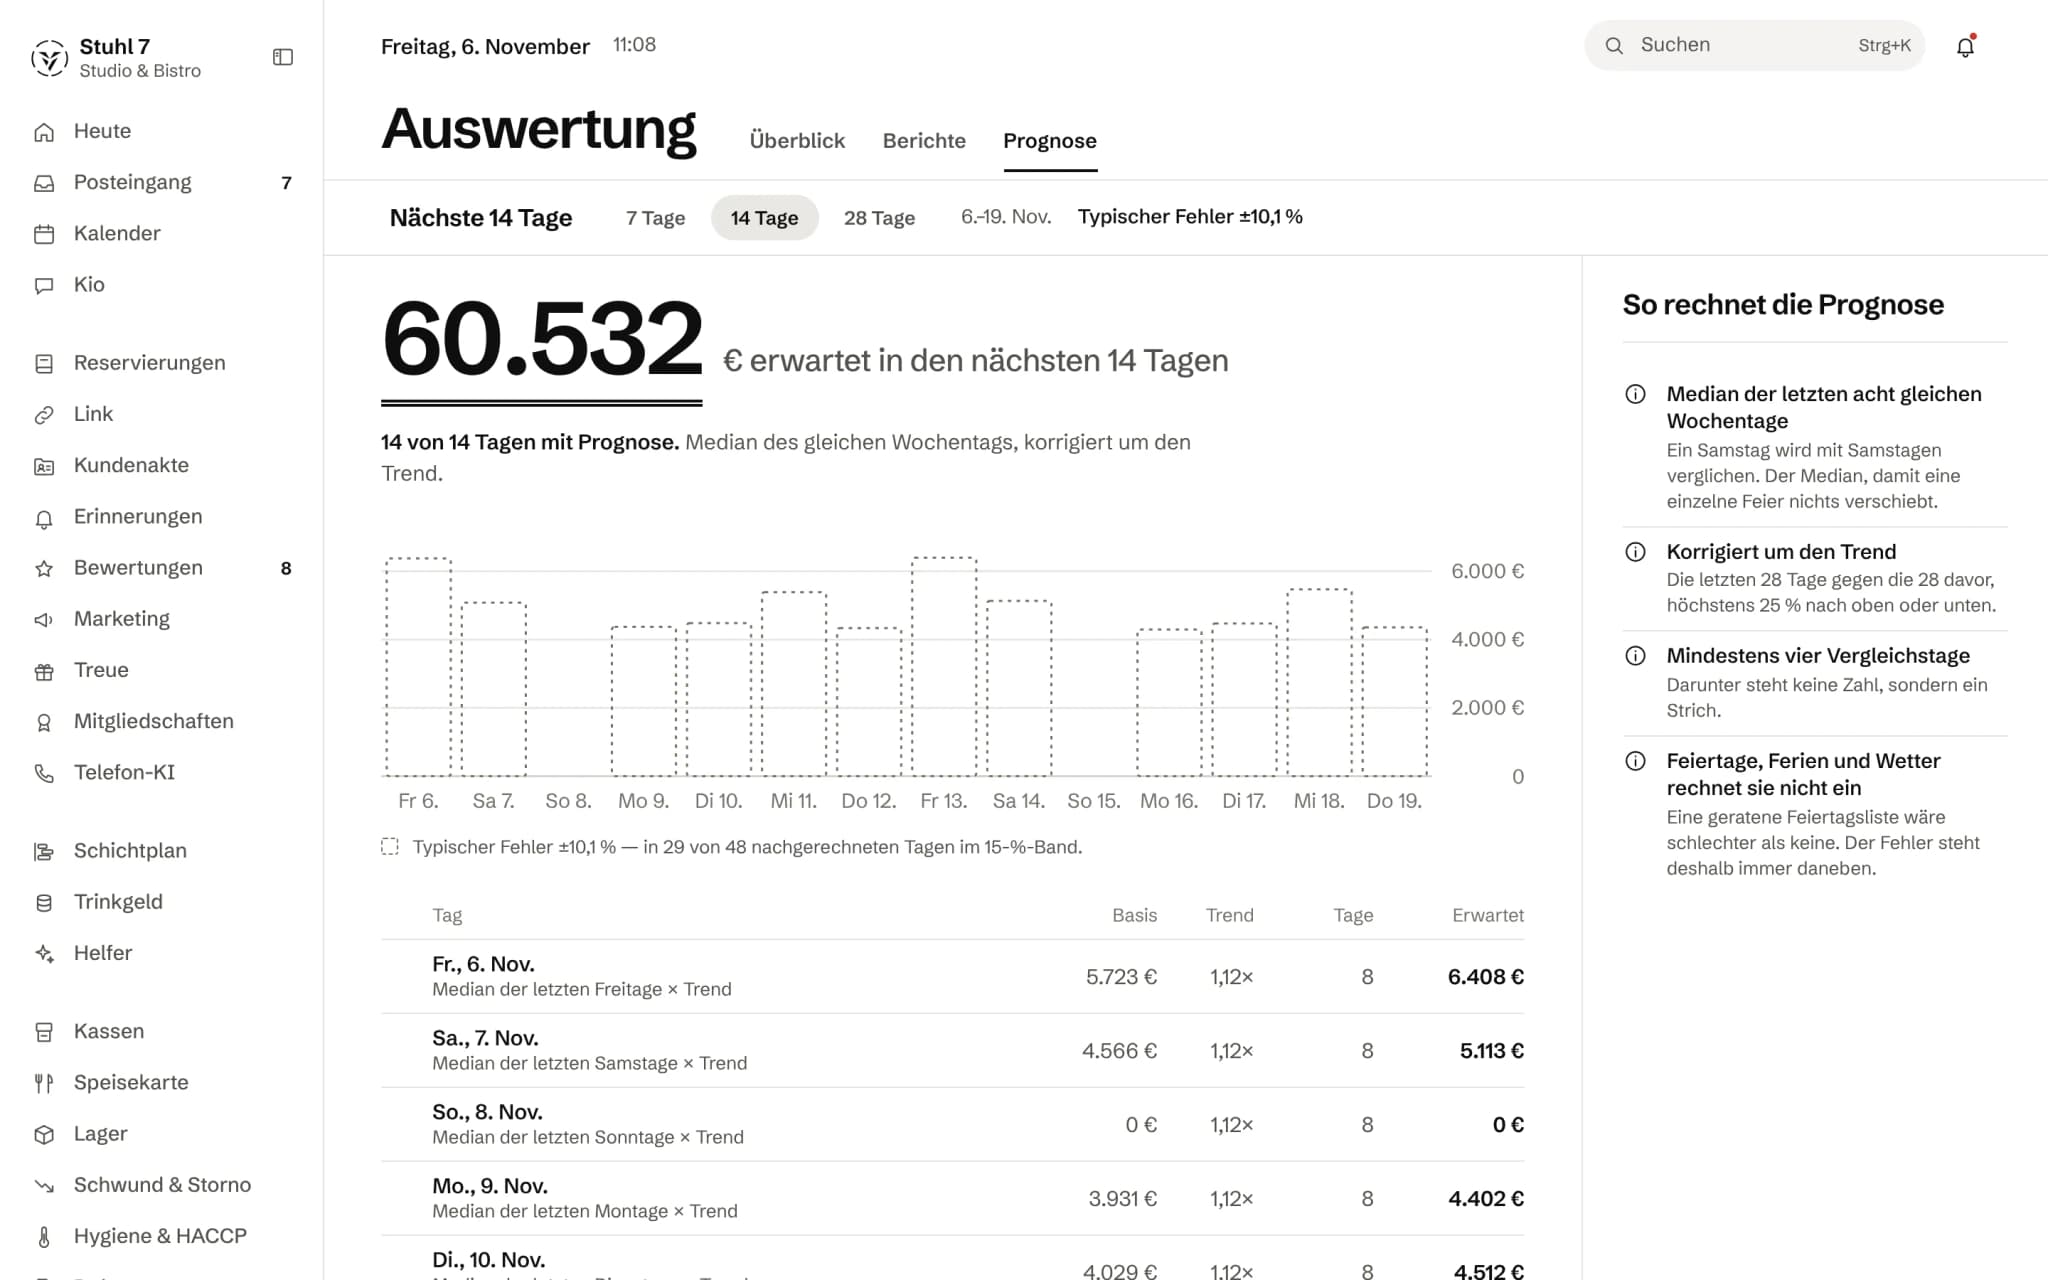
What the next days look like
Expected revenue for the chosen period, here 14 days.
One bar per day
Dashed, because it is an expectation and not yet a result.
Traceable for each day
Base, trend and comparison days the expectation comes from.
The error is shown
How far off the forecast typically is, as a percentage.
More about Analytics
Revenue, occupancy and other figures do not land in separate reports. Time series, forecasts and trade comparisons show how your business is moving and where something has changed.
A morning with numbers
Ten past six, and the numbers are ready.
Understand in the morning what happened yesterday — and what today will probably bring.
- 06:10Yesterday's revenue, occupancy, hours and guests are ready before anyone asks.
- 02The numbers come from your own till data and can be checked at any time.
- 03The time series shows whether the weak Tuesday is an outlier or a pattern.
- 04The industry benchmark shows whether it is yours or everyone's.
What is inside.
- Core figures
- Eight reports
- Time series
- CSV export
- Forecasts
- Flag on uncertain forecasts
- Trade benchmark
Ask Kio
Ask Kio instead of searching.
Kio reads along in the areas you have booked and answers in whole sentences, with the figures and where they come from.
Kio's figures are the same as in your Analytics.
Kio comes with every business: occasional questions are included in the Hub.
Meet Kio- You: How did October go compared to September?
- Kio:
Revenue 6% lower, on almost the same number of guests. Spend per guest was down, mostly on drinks.
Numbers with a source. And forecasts with their error.
Analytics reads the data from your till and your booked modules out of the same database. Next to every figure it says where it comes from, and next to every forecast how often it was right lately.
01
Overview
One period, every booked area, and a comparison with the period before.
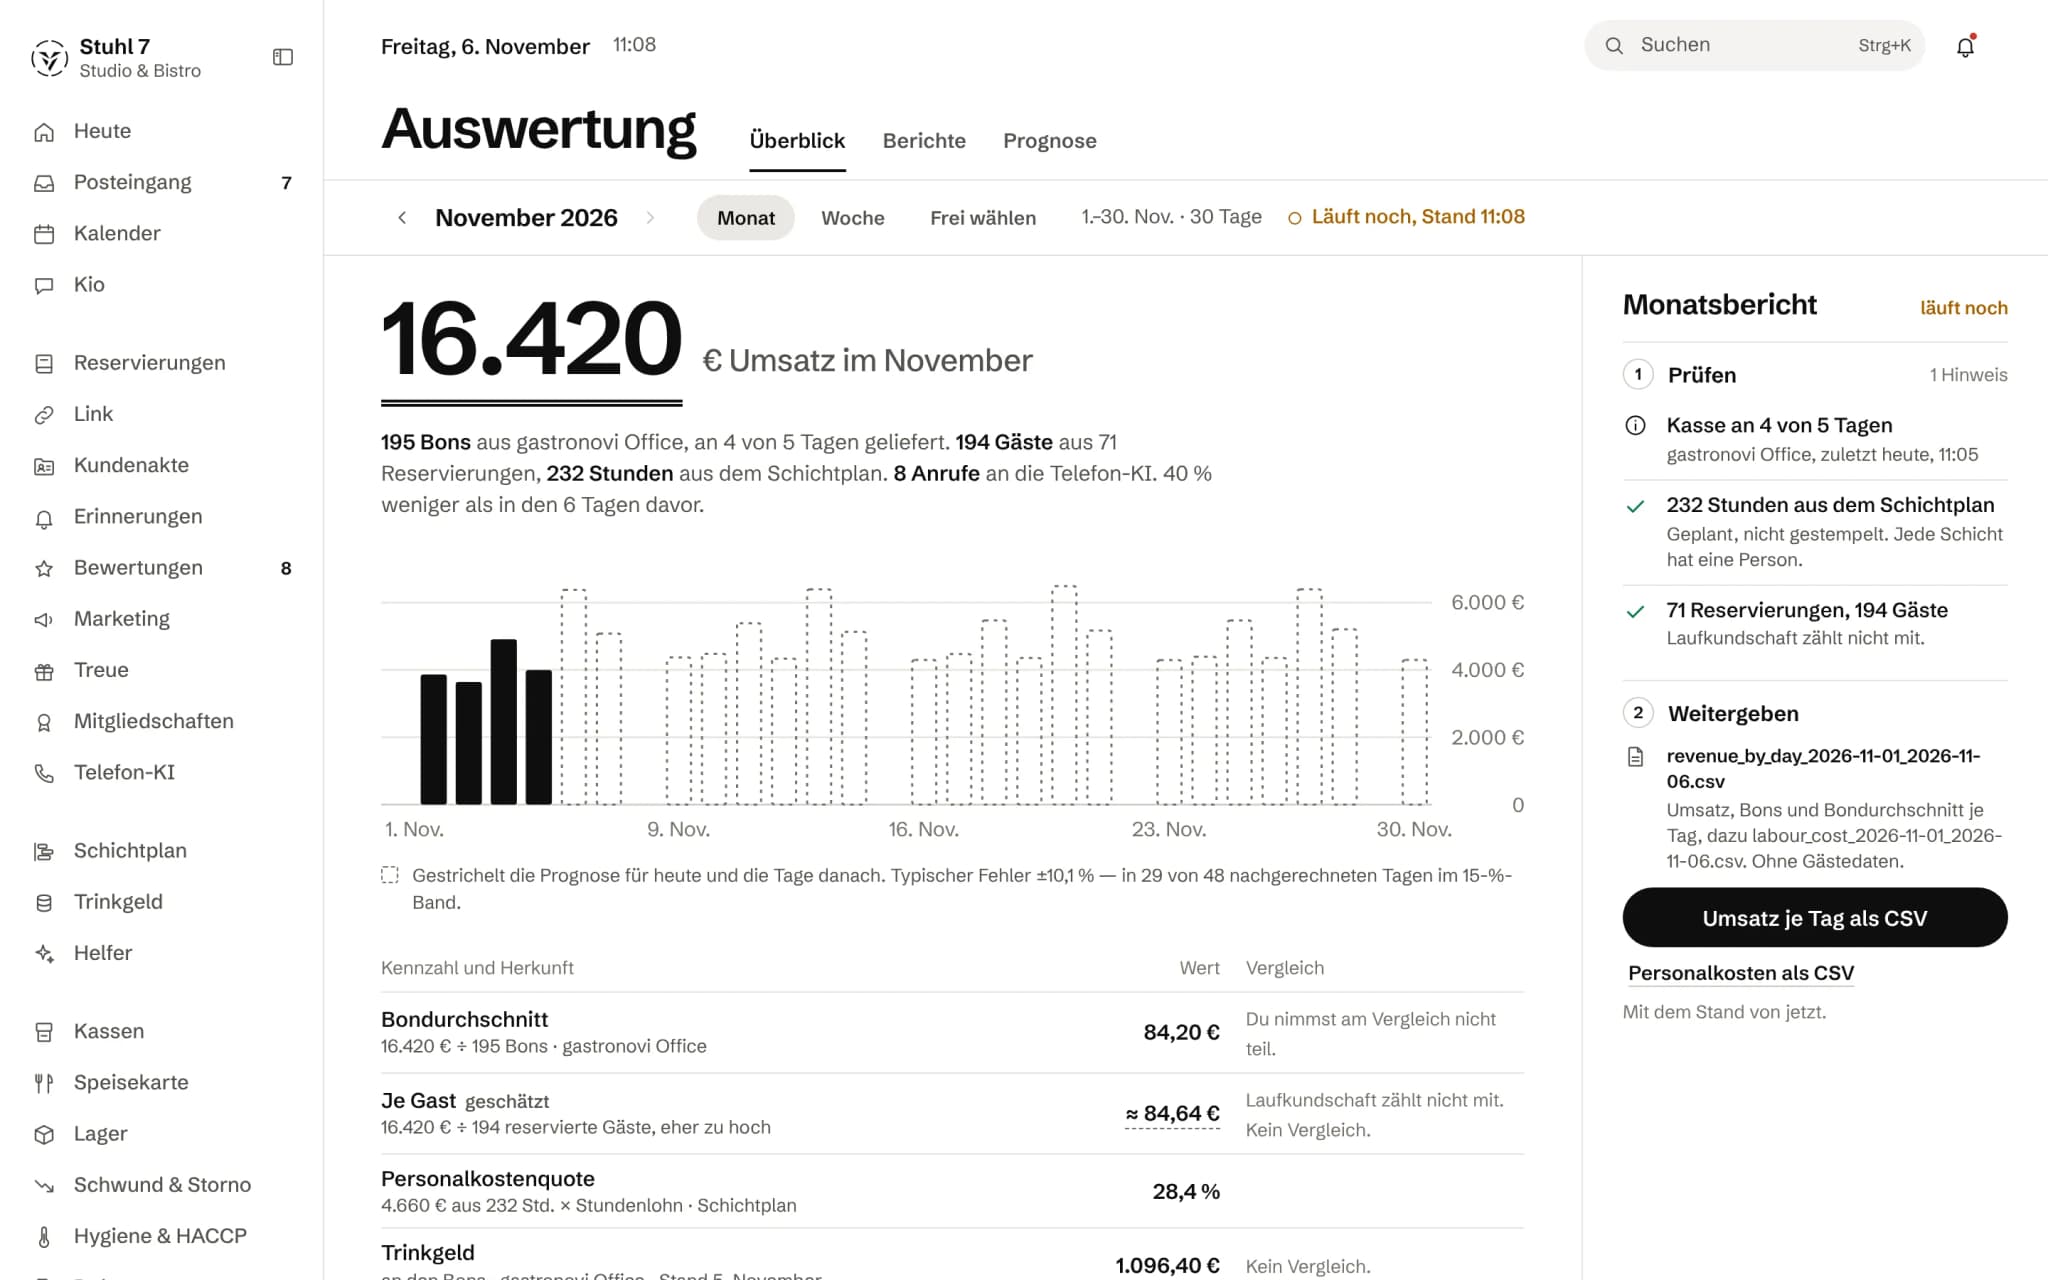
Revenue from your till
Revenue, receipts and average ticket per day from your till's receipts, compared with the period of the same length before.
What the modules add
Plus covers from Reservations, planned hours from the Rota, reminders sent and calls to the Phone AI, each only if the module is booked.
A source on every figure
Next to every figure it says how it comes about, for example revenue divided by receipts according to the till, or planned hours times hourly wage according to the Rota.
How complete
The Hub shows on how many days of the period the till delivered. A day without receipts is a rest day or a gap, and it says so.
A dash, not a zero
If the till sends no tips, you see a dash with the reason. A zero in the same type as revenue would be the absence of a field.
02
Reports
Eight fixed reports instead of a report builder, because a business wants answers, not queries.
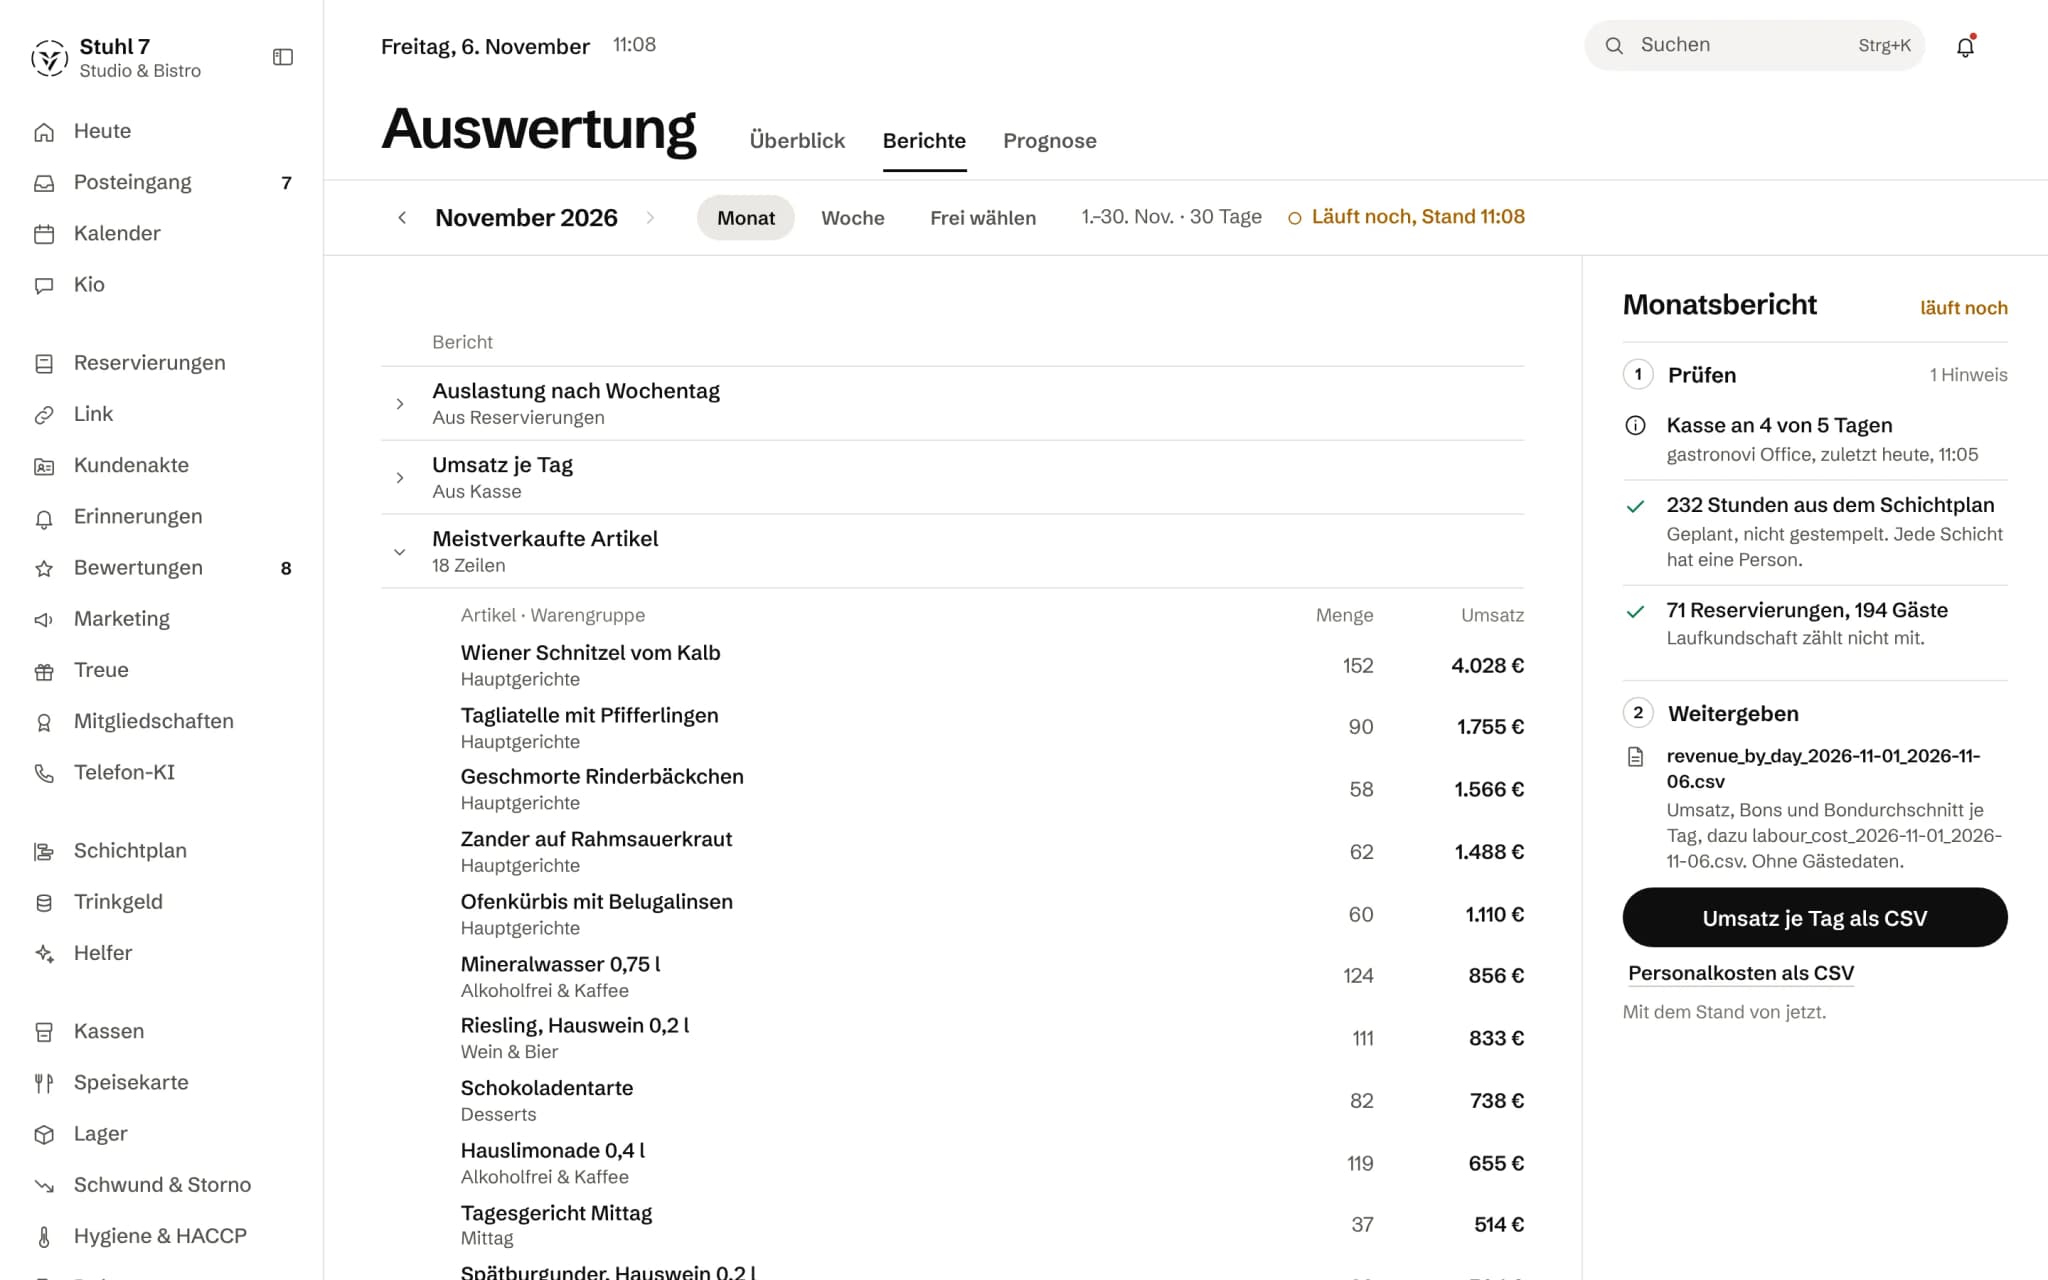
The eight
Load by weekday, revenue by day, best-selling items, labour hours against revenue, labour cost and ratio, staffing and revenue through the day, the effect of reminders, and calls to the Phone AI.
Labour cost in euros
Labour cost multiplies planned hours by hourly wage from the Rota, per day against revenue. Open shifts without a person are shown alongside instead of quietly flattering the ratio.
Through the day
Staffing and revenue are laid over each other through the day, averaged per weekday. That shows at what time of day too many or too few people are on.
Locked, not empty
If a report needs a module you have not booked, it shows with that module's name rather than as an empty table.
CSV to pass on
Every report goes out as CSV, with weekdays in your language, for your own spreadsheet or your accountant.
03
Forecast
What the coming days are likely to bring, and how sure that is.
Same weekdays
A day's revenue is estimated from the same weekdays before. A Saturday is compared with Saturdays, and a single party moves nothing.
Corrected for trend
The forecast takes into account whether your business has lately been growing or slowing. Each day shows its basis, trend and number of comparison days.
The error sits next to it
The Hub replays its forecast for past days as it would have been made at the time and compares it with actual revenue. That gives the typical error and how often the forecast came close.
A dash, not a guess
With too few comparison days there is no figure, only a dash. If there is not enough history yet to put a number on the error, it says exactly that.
04
Comparison with other businesses
Where you stand, without anyone learning where the others stand.
Voluntary and mutual
The comparison is voluntary, and only the owner can join or leave. If you do not take part, you do not see the others either.
Similar businesses
You are compared with businesses in the same trade and the same broad size class. The Hub works out the size class from revenue on every request, so a business that has grown does not stay in its old group.
Bands, not a league table
You see quarter bands for cost-of-goods ratio, labour cost ratio, void rate, discount rate and average ticket. You never see who is above or below you.
Only with enough businesses
A band only appears once enough other businesses in the same group have data. Below that there is no provisional figure either.
What it does differently. And why that matters.
Who in the business gets what out of it.
Technical details and data
Data
Figures come from your till's receipts and the data of all booked modules together. The Hub recalculates the daily figures every hour for the most recent days, so late receipts and corrections land on the day they belong to.
Business day
A receipt at half past one in the morning belongs to the evening before. Figures follow your business day, not midnight.
Booked modules
Analytics only shows figures from modules that are booked. A cancelled module keeps its history but no longer shows it here.
Export
Every report as CSV, periods of up to 400 days per request.
Forecast
Revenue per day for the coming days, with basis, trend, number of comparison days and back-tested error.
What it does not do today
Listed here so you know before, not once you are running it.
The forecast does not account for public holidays, school holidays or weather.
A guessed holiday list would be worse than none, which is why the error is always shown.
What is forecast is revenue per day, not the number of guests or individual items.
A PDF monthly report and scheduled sending by email do not exist yet.
There is no free-form query builder; the reports are fixed.
The trade comparison only appears once enough participating businesses of the same trade and size class have data.
At the start that can take a while.
Labour cost is based on planned hours, not clocked hours.
Walk-ins without a reservation do not count towards covers, so revenue per guest is an estimate.
Analytics is not bookkeeping and does not produce a DATEV posting batch.
Stronger together. Analytics and the rest.
All modules work on the same data. What Analytics knows, the others know too. Switch on what you need and see straight away what it costs together.

Your selection
0 €a month
- Analyticsincluded
Net. Try it for 14 days, the trial ends by itself.
Analytics costs
included
- Included in the Hub at no extra cost
- No base fee, no bundle
- Works with the data of your booked modules
Questions before you start
What businesses want to know before they switch it on.
When is there a forecast?
As soon as a weekday has enough matching weekdays in the recent past. The Hub puts a number on the error once it has been able to back-test enough days; until then it says that the forecast is an indication, not a planning basis.
What does “typical error” mean?
For past days, the Hub makes the forecast as it would have been made at the time, using only the data before, and compares it with actual revenue. It reports the typical error in per cent and on how many back-tested days the forecast came close. Rest days do not count as a missed forecast.
Do I need a Veydex till for this?
No. Analytics reads the receipts of your existing till through Connect. Without till data it shows what the booked modules supply, such as Reservations and the Rota.
Who sees my figures in the trade comparison?
Nobody, individually. Only ratios and the average ticket go into the comparison, what is shown are bands across a group of other businesses, and your revenue is never revealed. Test businesses do not count, and you can leave at any time.
Do I have to look at Analytics every morning?
No. Separately from the reports, every day from nine o'clock the Hub compares the previous day with the same weekdays before and only reports what clearly stands out and exceeds a minimum amount in euros. If the day's receipts are not in yet, it stays quiet.
Can I pass the figures on to my accountant?
Every report goes out as CSV, and with the Accounting access someone can read figures and reports without being able to change anything. Analytics does not produce a bookkeeping file such as a DATEV posting batch.
Why is a report missing for me?
Because it needs a module that is not booked. Labour cost, for instance, needs the Rota, and the effect of reminders needs both Reminders and Reservations. Locked reports show the missing module.
Understand in the morning what happened yesterday — and what today will probably bring.